Research
My recent research has focused on student understanding on the learning of
physics. This is a field classified as Physics Education Research. A
Google search will yield many PER groups, notably those at Oregon State University and
Montana State University.
I am currently developing 3D Printable Tactile Physics Learning Objects including physical objects such as pulleys and levers as well as calculated surfaces such as diffraction patterns and normal distributions. See my 3D printable objects page for a full list.
I have created several HTML5 applets to aid in learning of physics, including Newton's Second Law and a Special Relativity Lorentz Transformation applets. Please see my HTML5 page for a full list.
This is a Web version of a virtual laboratory originally made as a DVD video and series of laboratory experiments that I created to aid in learning of the process of neutron activation of materials. Please see my Neutron Activation Virtual Laboratory page.
Most recently, I have been making AR objects using Apple's Reality Composer for iPad on an iPad Pro to create USDZ VR object files. These items are then converted to GLB format using a stand alone program or an on-line converter. For these models, I used the FileStar* conversion program or the on-line site ASPOSE file converter.
Currently I have created three sets of AR objects: birds, Inuit stone carving art, and Physics Historical Apparatus.
The objects are displayed in the pages using Model-Viewer and the Google .js source api but can also be viewed as AR stand-alone objects using a current phone or tablet.
Anatomy of a Light Bulb Kit
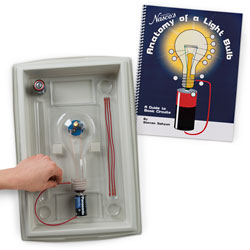
I created the
"Anatomy of a Light Bulb" kit produced by Nasco for students to more easily learn how an incandescent light bulb works.
Teaching at Hebei Normal University in Shijiazhuang, China
For the Spring 2012 semester, I had a one-semester sabbatical as a visiting professor teaching physics at Hebei Normal University in Shijiazhuang, China. During my sabbatical, I taught a course "A Review of Introductory Physics in English" to about 35 graduate students. In addition, I edited about 30 physics papers, abstracts, and letters that were being submitted to journals. This was very interesting experience and I have created a short (7 min) slideshow chronicling my time at in China. See my Projects Page for more slideshows and fun things. During the summer of 2013, I returned for another two month visiting professor position teaching and editing research papers.
Auditory Graphs
My research has also centered around students' use of auditory graphs. I
worked with the Science
Access Project research group at Oregon State University's Physics
Department, and my advisor was Dr. John
Gardner. I most recently headed studies to develop information and manuals for the
TRIANGLE
and Audio
Graphing Calculator programs.
I have also worked on non-visual methods to represent information
contained in graphs and pictures that are used in physics. Specifically,
I have developed web based tests to compare visual and auditory (sound) graphs.
Several examples of auditory graphs can be found on the Sonitypes
page. For this project I created a data conversion program, called
DataReader, which converted X Y data pairs into an SLG sound file format that could then be converted into a MIDI sound file.
The main focus of my Ph.D. research was centered on the Auditory vs. Visual
Graph Test that I developed. This test compared subjects'
abilities to answer math and physics questions when receiving either
visual or auditory graphs. Another study that I developed and conducted
used an Auditory Preference Test to compare subjects' preferences for different types
of auditory graphs.
The graphs were developed using AudioPlot controls as can be heard from this demonstration page.
Results from these tests are in my Ph.D.
Thesis (html version) which I successfully defended on April 30, 1999. A .pdf summary paper of the thesis is here.
In addition, findings from my graph studies helped with the development and audio graphing feature set for the Audio Graphing Calculator produced by ViewPlus Technologies
Additional resources related to Auditory Graphs:
Representing Data With Sound
Sonitypes (archetypes of basic data representation)
Accessible Graphing Calculator produced by ViewPlus Technologies
Publications:
Goldberg, F., Price, E., Basir, M., Escalada, L., Maier, S., Sahyun, S., Snyder, T. D., and Zeng, L. Value Creation in a Pedagogically-focused Faculty OnlineLearning Community. Journal of College Science Teaching pp. 523-531 (1/24/2024).
Bülbül, M. S. and Sahyun, S. C.. A Distance Experiment with a Blind Partner Balkan Physics Letters, 18, 181022, pp. 165-170 (2010)
S. C. Sahyun, J. M. Polak, and C. J. Moore. Undergraduate student laboratory experience at the Synchrotron Radiation Center American Journal of
Physics, November 2006, Volume 74, Issue 11, pp. 987-991
S. C. Sahyun and P. J. Siemens. CageLab: A low-cost apparatus to demonstrate rotational motion for advanced
undergraduates American Journal of Physics, June 2005, Volume 73, Issue 6, pp. 566-570
S. Sahyun A Comparison of Auditory and Visual Graphs for Use in Physics
and Mathematics Ph.D. Thesis, Oregon State University,
Corvallis, OR. 1999.
S. Sahyun. Mode Transitions of an External Cavity Diode Laser.
(1992) M.S. Thesis, Montana State University, Bozeman, MT.
R.Penland, R. Cormakc, J. Carsten, S. Sahyun, and K. M. Johnson. (1990)
Holographic Sundial, Optics Letters 15 (17) pp.
929-31.
For a list of Talks and Posters presented, please see my
Conferences page.