Representing Motion on Speed-Time Graphs – Question 1
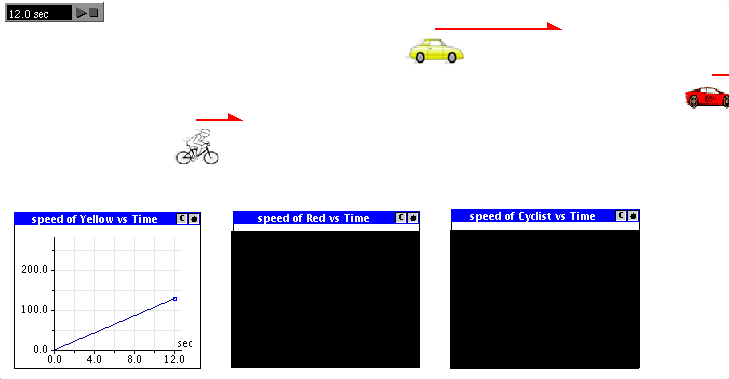
The final frame of the movie on the last slide is shown below. It includes the speed-time graph for the yellow car.
Image showing red car to the right, yellow car in middle, and bicyle on the left.
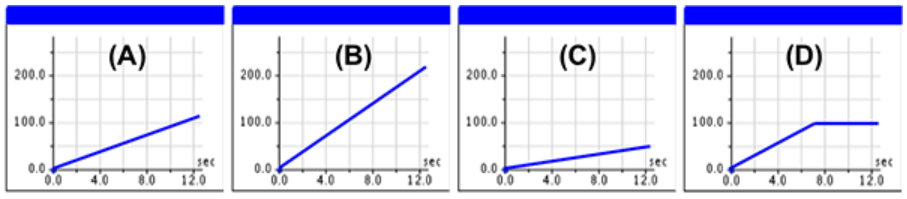
Here are four possible graphs to choose from for the following questions:
(A) medium slope, (B) steep slope, (C) low slope, (D) steep then flat.
As an additional check on your understanding,the next page shows the same movie on with all three graphs.
Transcript / Long description
The final frame of the movie on the last slide is shown to the right. It includes the speed-time graph for the yellow car.
Which of the graphs below do you think will represent the motion of the bicycle? Of the red car? Make your choice from the pull-down menu.
Feedback: For feedback, you’ll watch the same movie on the following slide that shows all three graphs.