Earlier in this activity, you learned that for objects speeding up, the slope of the line on the speed-time graph was related to the rate of speeding up: a steeper slope meant the object was speeding up at a higher rate.
Below are speed-time graphs for three objects first speeding up, and then slowing down at different rates. Match each speed-time with its relative rate of slowing down.
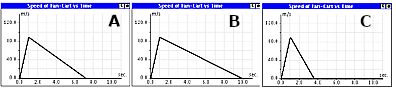
(A) A speed-time graph with a moderate slope, (B) A graph with a low slope, (C) A graph with a large slope.
The relationship between the slope of the line on the speed-time graph and the rate of change of speed of the object is similar for objects speeding up or slowing down. The steeper the (negative) slope of the line representing slowing down, the higher the rate of slowing down.
Transcript / Long description
Representing Motion on Speed-Time Graphs – Rate of slowing down
Earlier in this activity, you learned that for objects speeding up, the slope of the line on the speed-time graph was related to the rate of speeding up: a steeper slope meant the object was speeding up at a higher rate.
Below are speed-time graphs for three objects first speeding up, and then slowing down at different rates. Match each speed-time with its relative rate of slowing down.
Feedback: The relationship between the slope of the line on the speed-time graph and the rate of change of speed of the object is similar for objects speeding up or slowing down. The steeper the (negative) slope of the line representing slowing down, the higher the rate of slowing down. The bottom graph has the steepest slope and thus the highest rate of slowing down. The middle graph has the shallowest slope and therefore the lowest rate of slowing down.