Representing Motion on Speed-Time Graphs – Introduction
In the first lesson of this unit you learned about how to use speed-time graphs to represent the motion of objects that were either speeding up or slowing down.
In this extension activity, you will learn about how to use speed-time graphs to determine the rate of change in speed.
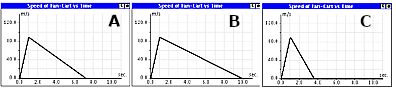
Another purpose of this extension is to let you investigate how to use speed-time graphs to represent objects that are slowing down. The figure below shows a few examples of speed-time graphs you will encounter in this Extension.
In the first lesson you also may have noticed that many of the questions were preceded by one of the following small pictures, or icons.
Another purpose of this homework is to discuss what these icons represent and how each guides you in how to answer questions in the course.