The object of this test is to compare students' ability to answer
questions from data contained in graphical formats. Two types of
graphs are utilized, pictorial graphs which almost everyone is familiar
with, and sonified data graphs (data represented by sound), which is
much less common. For the
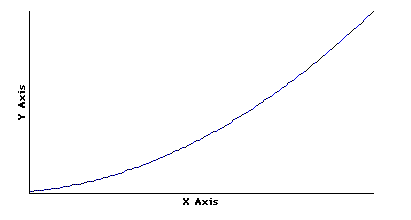
pictorial graphs, you will need a web browser such as Netscape or
Explorer which can display .gif images. An example of
such an image is the following:

If you do not see a bar above this line, QuickTime is not properly installed on your browser. If you do see the control bar, click on the "play" arrow to listen to the graph. The slider bar gives an indication of how much time has elapsed, you can move the slider to any point in the graph and play from that point.
To listen to the graph as a midi file, click on the MIDI link above; your browser should be configured to automatically start a midi player to listen to the file. You can also download the file by shift-clicking on the link. To listen to the graph as a .wav file, click on the WAV link above; again, your browser should be configured to automatically start a sound player after the file has downloaded. If you can hear the QuickTime graph then you do not need to use these links.
The y-axis of the sound graph is represented by pitch and the x-axis is represented by time. The second derivative, or the rate at which the graph is increasing or decreasing is represented by the background "clicks." Play the graph several times and match the sound graph to the picture above.
Statement of Informed Consent
Physics Department, Oregon State University
Title of Project: Comparison Between Auditory and Visual Graphing Methods.
Investigators:
This purpose of this study, as stated above, is to determine whether auditory graphing (data representation using sound) is comparable to visually displayed graphs. In particular, this study will be examining how well conclusions can be drawn from auditory graphs vs. visually displayed graphs.
How the test will work:
The format for this test is divided into several parts. First subjects
will be asked to give their name and a school code which is used to
identify which testing group the student is from.
Next, a demographic survey will be presented to the subject for completion. This is to receive some indication of the subject's background and training. A Pretest follows the survey and consists of five questions about two different graphs.
Finally, the subject is given a series of questions relating to physics and graphs. The questions are to be answered from the information contained within the graphs, although the subject matter is drawn from material that students are exposed to during a first year general physics course at a typical college or university. Subjects will be randomly assigned to one of three groups. Those using picture graphs, those using sound graphs, and those using both sound and picture graphs (please listen to the graphs before answering the questions!) There will be 14 questions in the main test. Only data from subjects who answer all 14 test questions will be used.
It should be noted that all responses are being transferred on the Internet, and are not encrypted. However, reasonable attempts at confidentiality are made in that the subject's name will not appear with, or be stored with, any of their responses. Names will not be used in any publications or presentations of the data obtained.
It should also be noted that in cases where student subjects are taking this test for extra credit in a course, a list of which students have taken the test will be forwarded to the respective school's instructor so that those subjects may receive credit. Results of the study will not be used to determine credit. Also, a summary listing of the average responses to the test questions will be available to the instructor.
Participation in this study is voluntary and you may either refuse to participate or withdraw from the study at any time, although full participation is greatly appreciated.
If you have any questions about the research study and/or specific
procedures, please contact:
Steven Sahyun
Physics Department
Oregon State University
301 Weniger Hall
Corvallis OR, 97330
USA
The phone number is (541) 737-1712.
Any other questions should be directed to Mary Nunn, Sponsored Programs
Officer, OSU Research Office, Oregon State University, Corvallis, OR,
97331. The phone number is: (541) 737-0670.
After reviewing and agreeing to the above procedure,
Questions about this test? Send me e-mail: sahyuns@ucs.orst.edu
Last modified October 12, 1997.