>> load single.csv
>> [n,p] = size(single)
n =
3456
p =
2
>> x = single(1:3455,1);
>> y = single(1:3455,2);
>> plot(x,y)
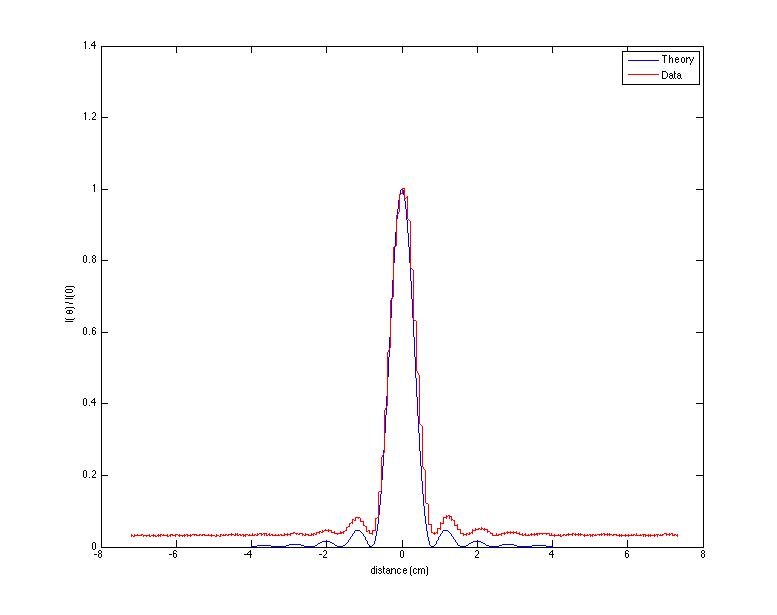
Now all you need to do is to model the single slit plotting so that the x axis is the same scale (cm would be most useful.) and plot the two graphs together on the same plot.
You can use the command:
>>hold on
to plot multiple graphs together. To clear the graph window, use
>>clf();
To make MatLAB stop plotting graphs together, use:
>>hold off